Other Sites:

Database Fundamentals
General definition: A database is any collection of related data.
Restrictive definition: A database is a persistent, logically coherent collection of inherently meaningful data, relevant to some aspects of the real world.
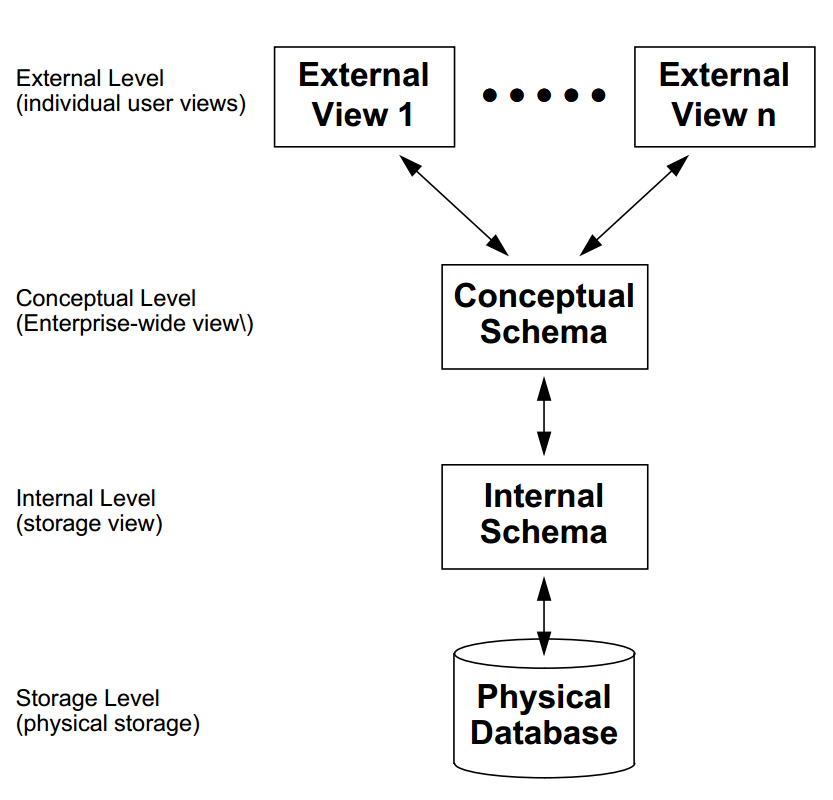
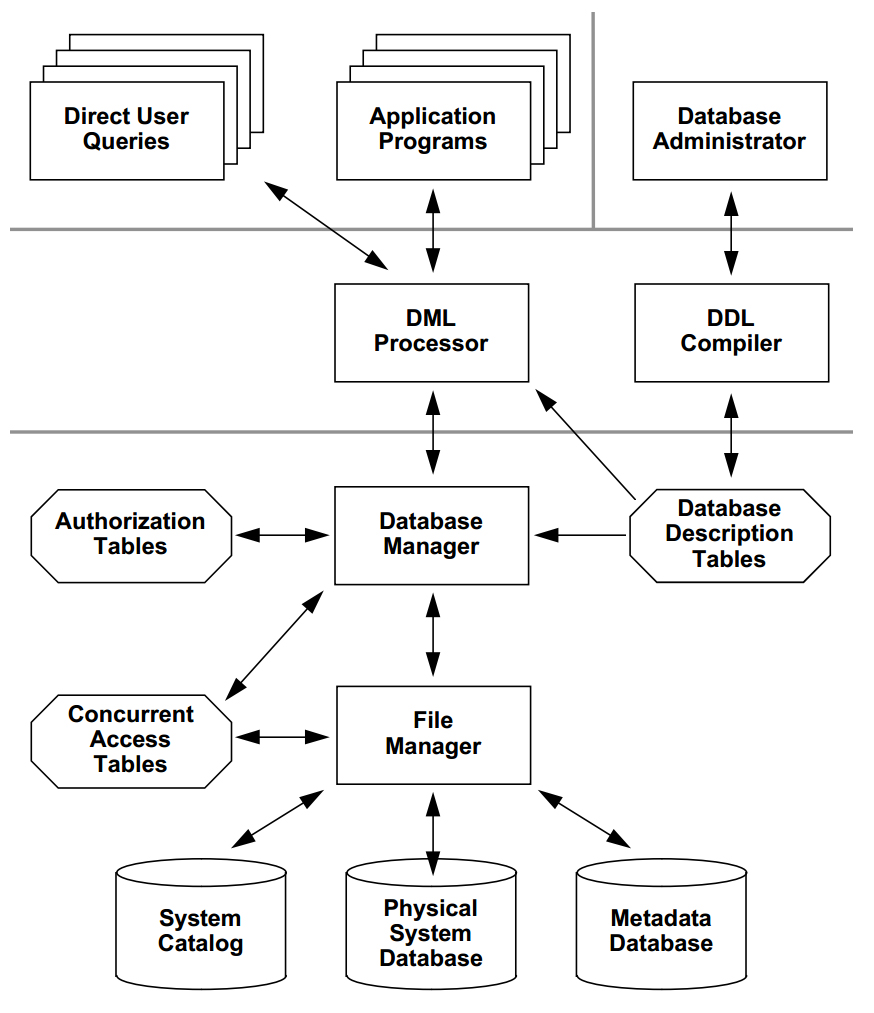
A database management system (DBMS) is a collection of programs that enables users to create and maintain a database. According to the ANSI/SPARC DBMS Report (1977), a DBMS should be envisioned as a multi-layered system:
Database management systems provide several functions in addition to simple file management:
Many different individuals are involved with a database management system over its life:
The top layer of a database system is where users and administrators interact with the system.
The middle layer of a database system is where the logic of the system occurs. The structure of the database is created and maintained using a data definition language (DDL) and the content of the database is added, managed, and searched using a data manipulation language (DML).
The bottom layer is where the system interacts with the operating system and the hardware of the underlying computer infrastructure.
What is a relational database?
What is a relation?
| SET | any collection of distinct entities of any sort |
| examples |
A = {1,2,3,4,5,} B = {H,T} C = {R,B} D = {Grant,Sherman,Lee} |
| CARTESIAN PRODUCT | a set of ordered pairs, produced by combining each element of one set with each element of another set. |
| example | B x C = {<H,R>,<H,B>,<T,R>,<T,B>} |
| Note | Cartesian products may be generated by multiplying any number of sets together. The actual number of sets involved in a particular case is said to be the degree or arity of that Cartesian product. |
| Relation | a subset of a Cartesian product |
| example | Q = {<H,R>,<H,B>} |
| Note | relations may be of any degree (arity). |
A set is usually indicated by a comma-delimited list of the names of its members within a pair of wavy brackets.
| R | = | { 1,2,3,4,5,6 } |
| G | = | { Marshall, Eisenhower, Bradley } |
The members of a set are unordered. Two sets are considered equivalent if and only if they contain exactly the same members, without regard for the order in which the members are listed.
| R | = | { 1,2,3,4,5,6 } |
| = | { 3,2,1,6,4,5 } | |
| G | = | { Marshall, Eisenhower, Bradley } |
| = | { Bradley, Marshall, Eisenhower } |
An ordered double (or triple or quadruple or n-tuple) is usually indicated by including a comma-delimited list of the names of its members within a pair of pointed brackets:
| S | = | < 2,4> |
| C | = | < Marshall, Eisenhower, Bradley > |
Order must be maintained in ordered n-tuples. Two tuples are considered different if they contain the same members in a different order.
| S | = | < 2,4 > ≠ < 4,2 > |
| C | = | < Marshall, Eisenhower, Bradley > |
| ≠ | < Bradley, Eisenhower, Marshall > |
A set may consist of an unordered collection of ordered tuples. For example, we could imagine the set of all ordered pairs of integers, such that the first element is the square root of the second element.
| R | = | { < 1,1 > , < 2,4 > , < 3,9 > , ...} |
| LET | R be the set of possible outcomes when rolling a single red die. |
| R | = | { 1,2,3,4,5,6 } |
| LET | B be the set of possible outcomes when rolling a single blue die. |
| B | = | { 1,2,3,4,5,6 } |
| THEN | The Cartesian product R x B gives the set of all possible outcomes when the two dice are rolled together: |
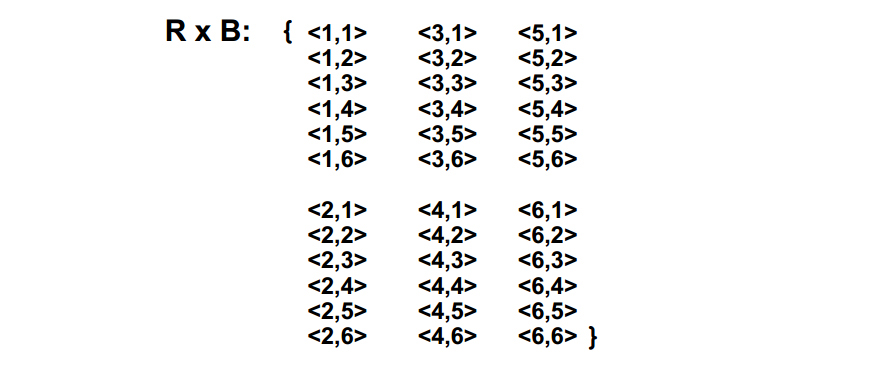
A Cartesian product of two sets can be generated by combining every member of one set with every member of the other set. This results in a complete set of ordered pairs, consisting of every possible combination of one member of the first set with one member of the second set. The number of elements in a cartesian product is equal to M x N, where M and N give the number of members in each set.
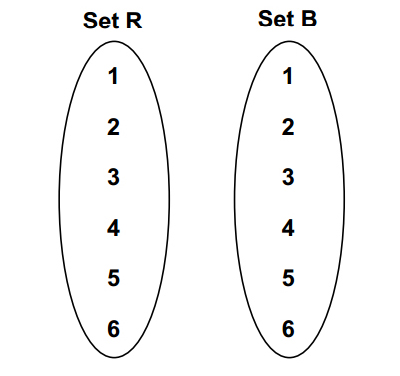 |
Starting two sets |
|
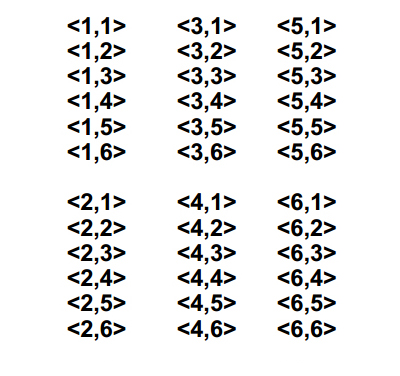
A Cartesian product of two sets, shown as a list of ordered pairs. |
|
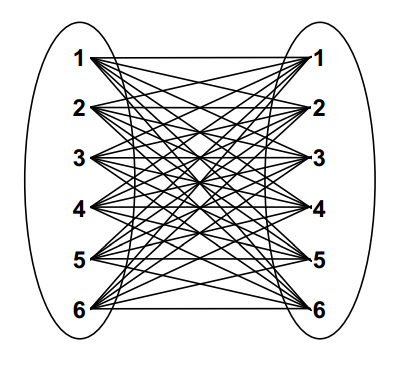
A Cartesian product of two sets, shown as a connection diagram, with each member of the first set connected to each member of the other set. |
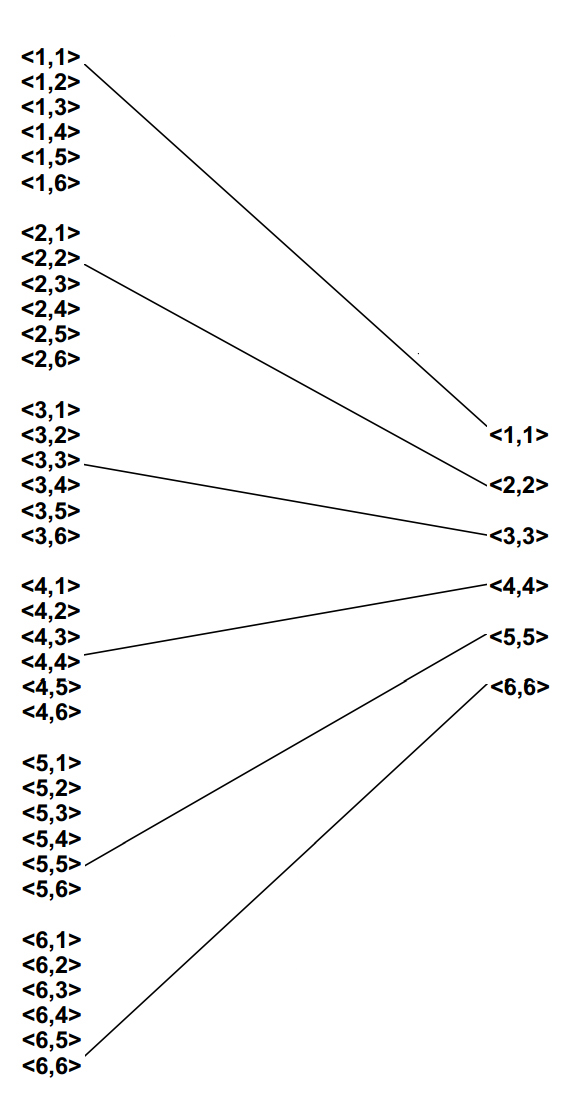 |
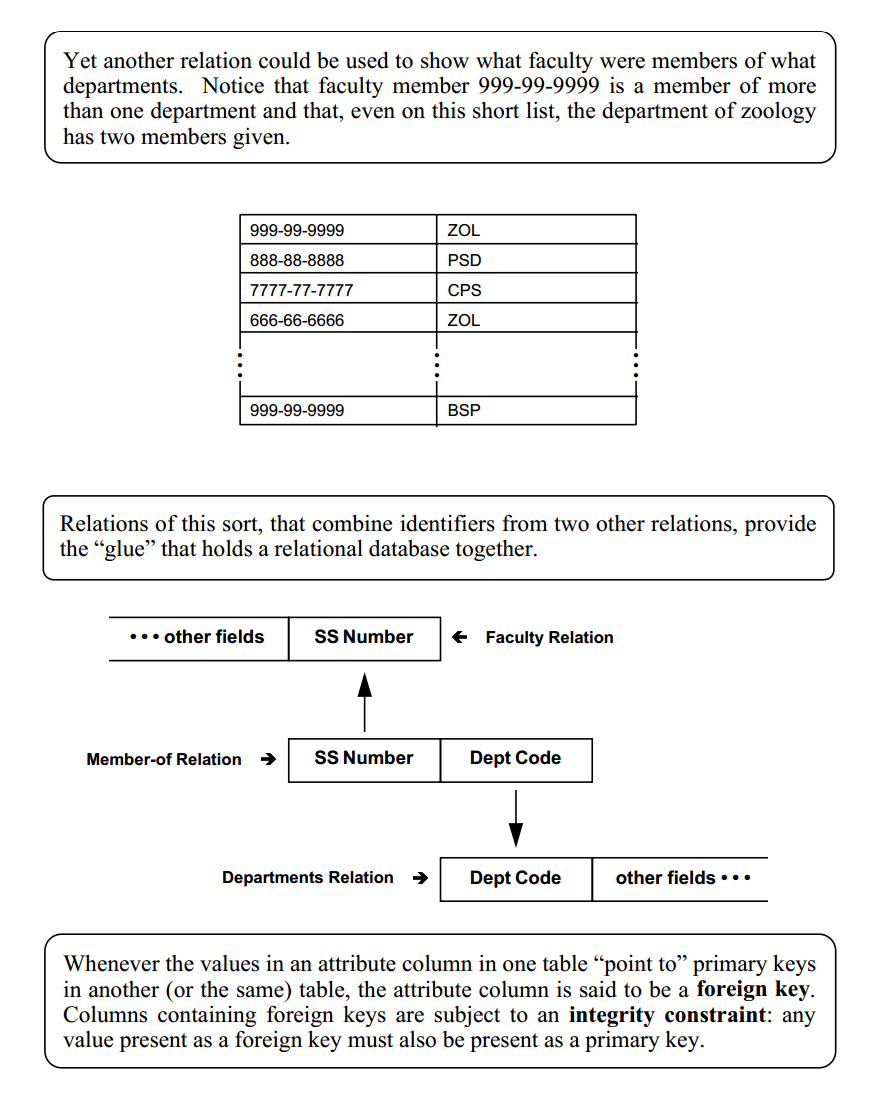
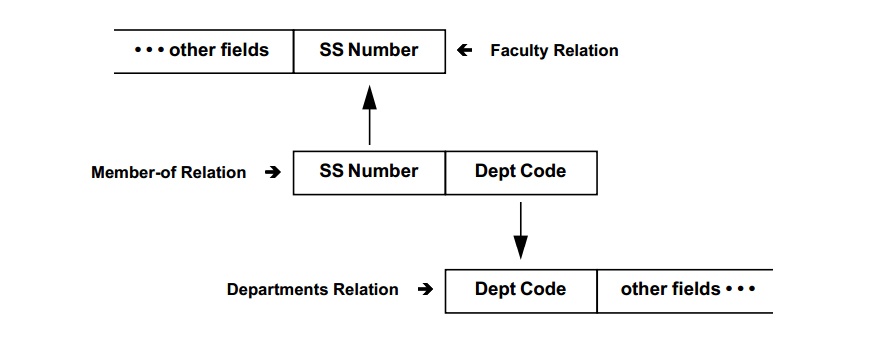
A Cartesian product pairs every member of the first set with every member of the second set. A relation pairs some members of the first set with some members of the second set. A relation, therefore, must always be representable as a subset of a Cartesian product. |
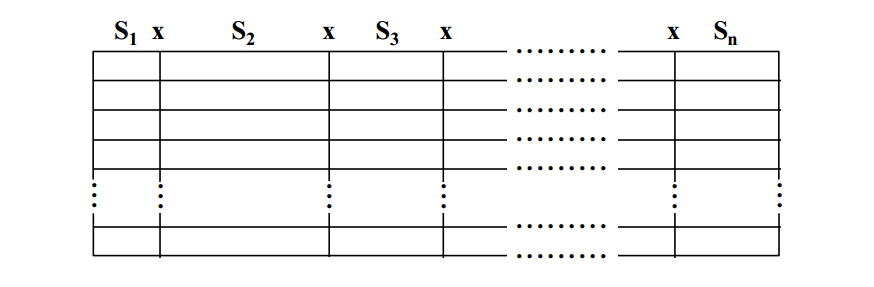
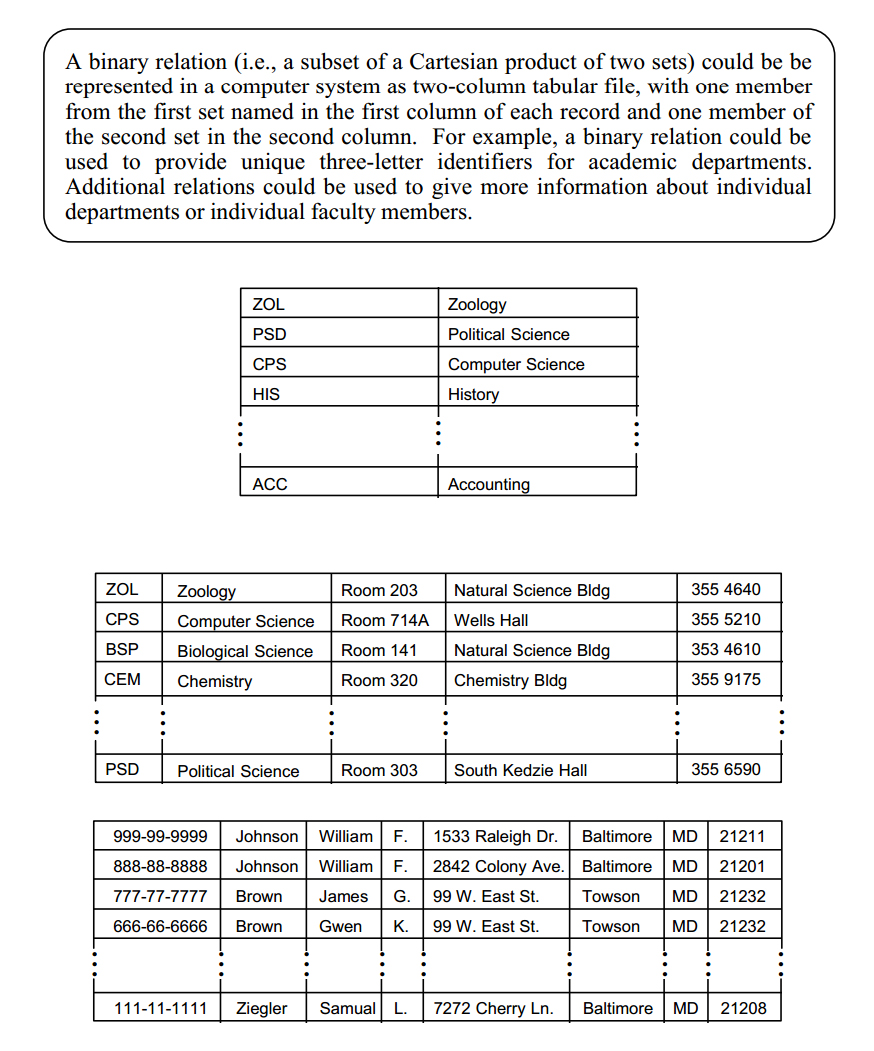
A binary relation is a set of ordered doubles, with one element a member of the first set and one element a member of the second set. Generally, we could represent a set of ordered doubles as below. S1 is the first set and S2 the second.

By adding sets, relations can be extended to include ordered triples, ordered quadruples or, in general, any ordered n-tuple, as below. A relation with n participating sets is said to be of degree n or to possess arity n.
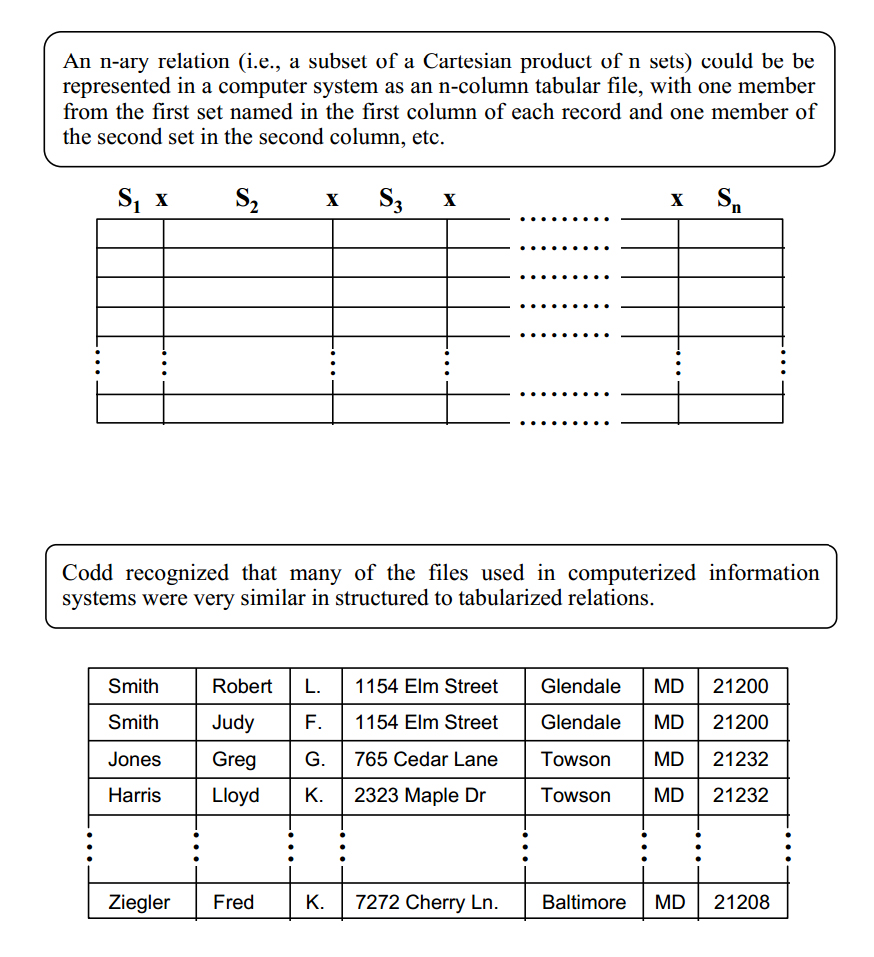
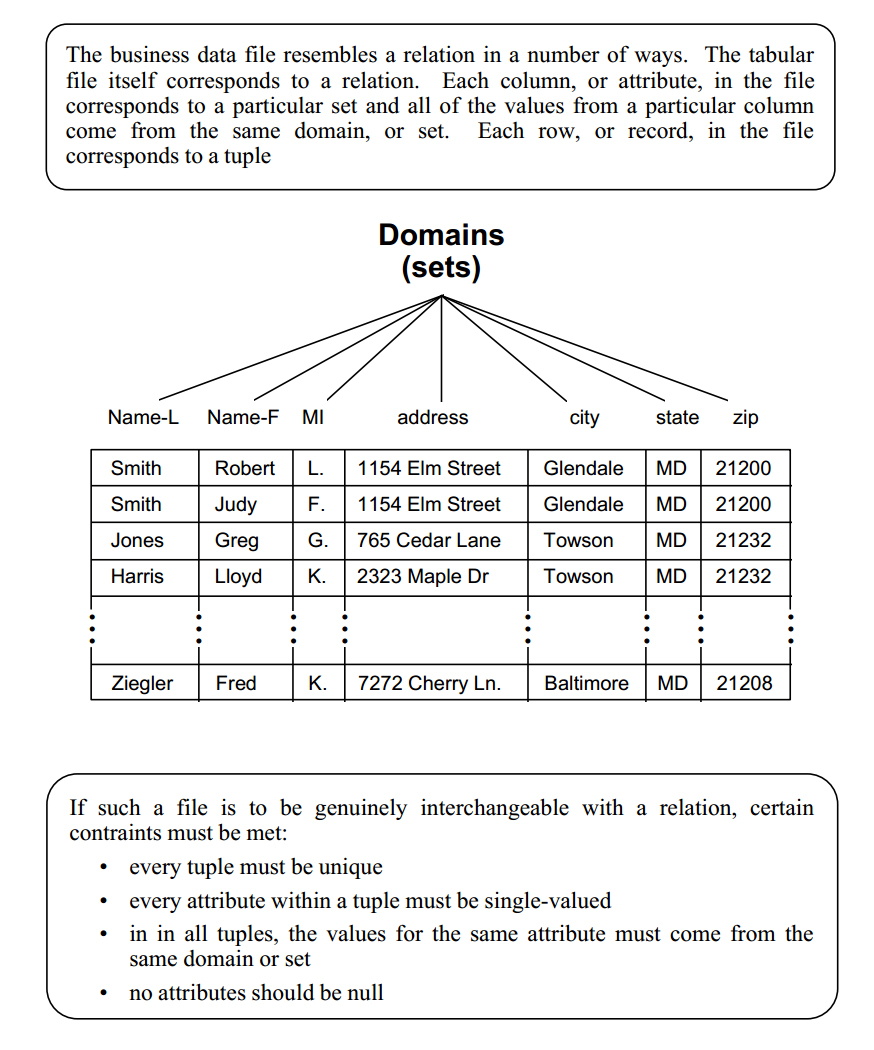
Data models consist of data structures and permitted operations on those data structures. Part of Codd's genius was to recognize that many of the standard set operators that can take relations as operands map nicely to real data manipulation problems:
Codd devised some additional operators to provide extra manipulatory power:
The original operators have now been extended to include some additional useful manipulations:
Considerable study has been made of the properties of relations as they affect the behavior of relational databases. The results of these studies are captured in the definition of normal forms.
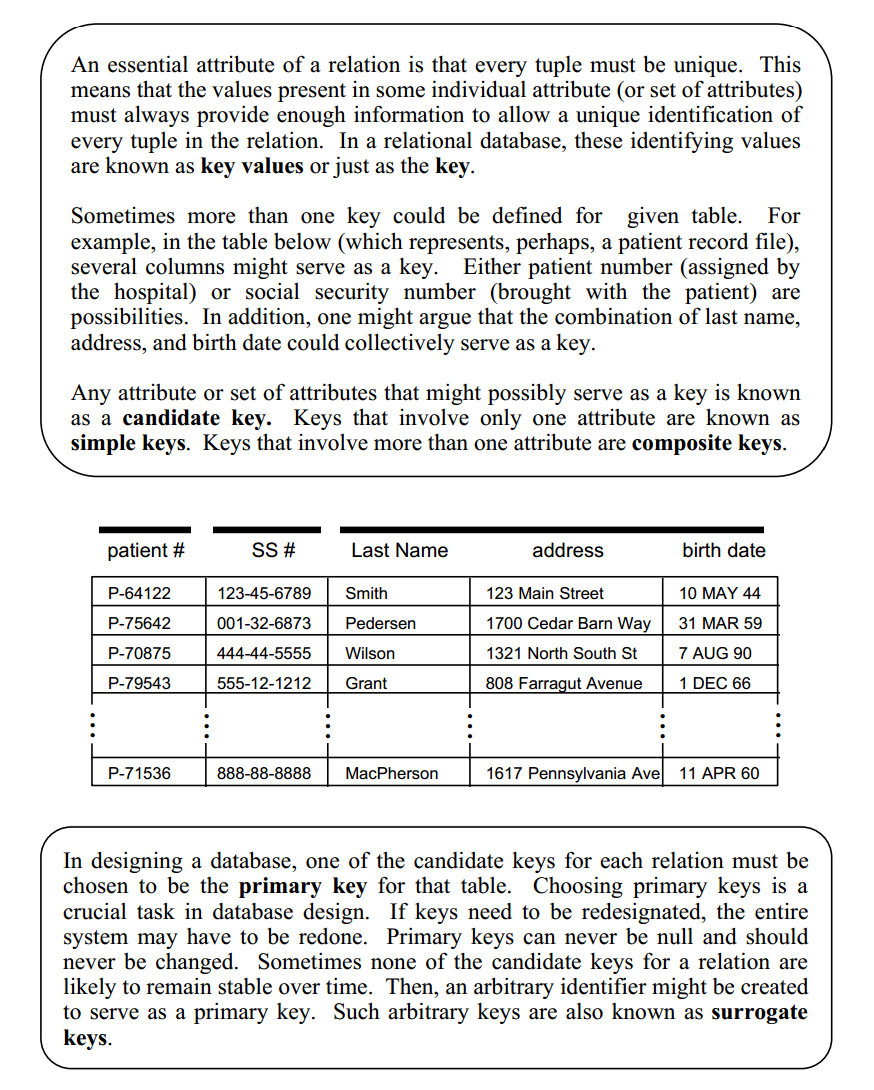
First Normal Form:
A relation is in first normal form (1NF) if and only if all underlying domains contain atomic values only.
Second Normal Form:
A relation is in second normal form (2NF) if and only if it is in 1NF and every non-key attribute is fully dependent on the primary key.
Third Normal Form:
A relation is in third normal form (3NF) if and only if it is in 2 NF and the non-key attributes are mutually independent.
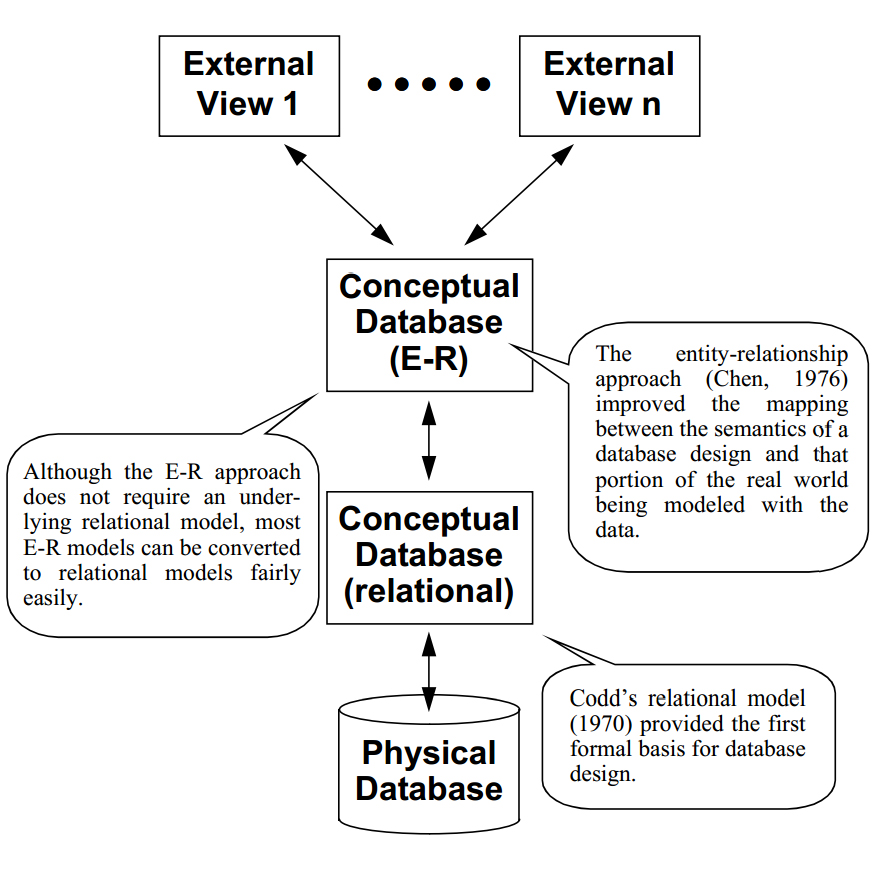
The Entity-Relationship (E-R) data model is a semantically rich model that can be mapped to a relational system.
Different needs for access and use of the database can be supported through different user views
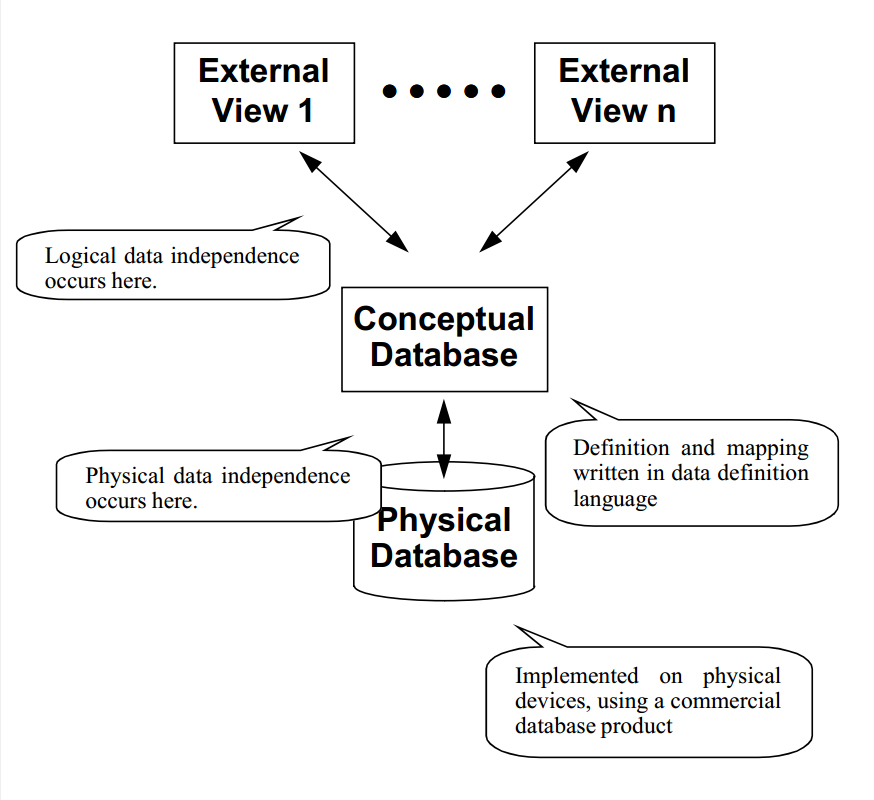
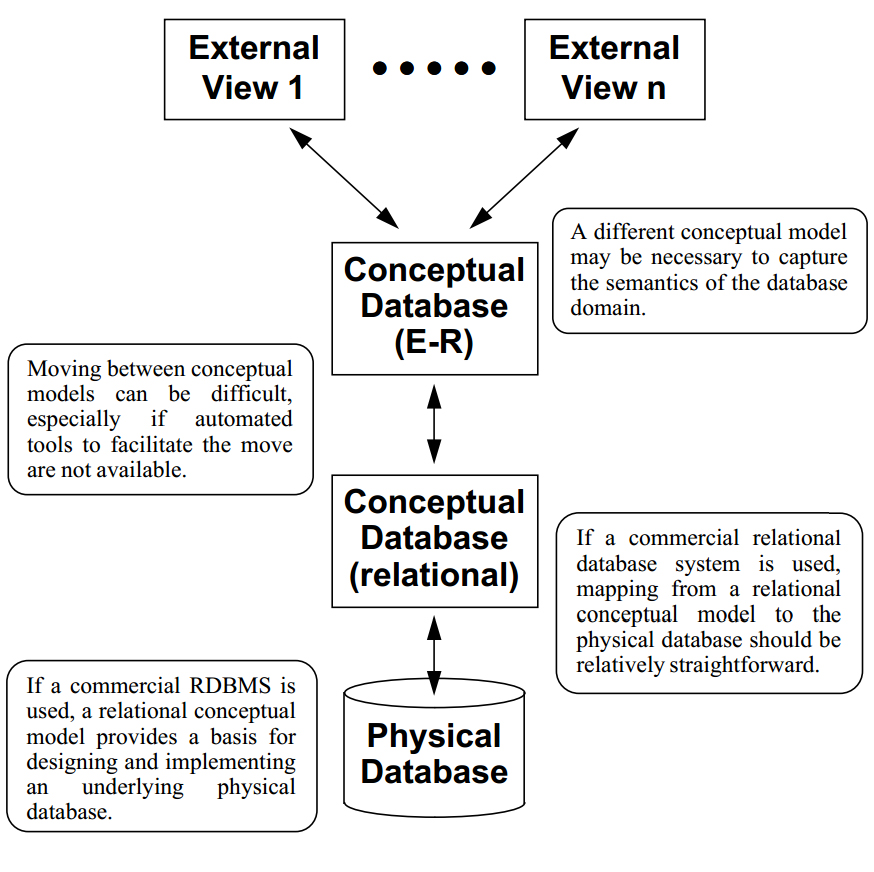
Layers may be added to a conceptual design in order to increase the semantic richness available at the top design level.
If layered conceptual models are used, the layering may be perceived differently by the system's users and developers. Users often see the database only in terms of the views that they employ. System analysts and designers may think primarily about the E-R schema, whereas the database administrator is likely to deal primarily with the relational schema and the physical system.
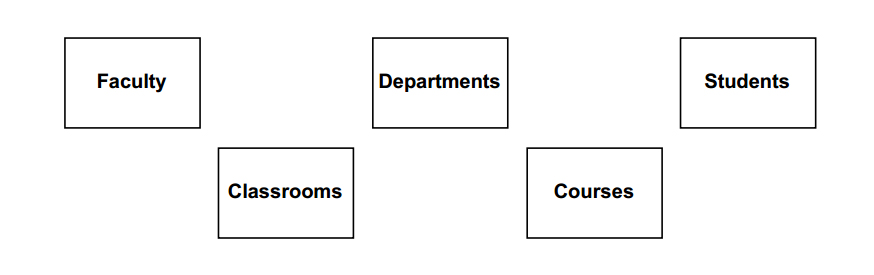
Sets of real-world entities are represented with named rectangles:
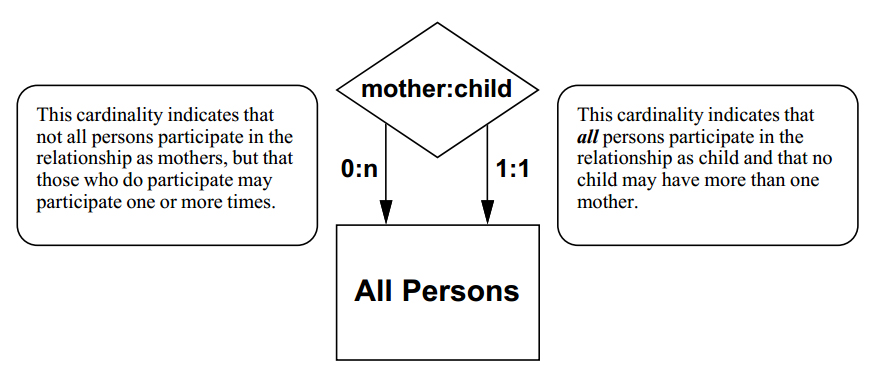
Relationships between members of entity sets are represented with named diamonds that are connected to the rectangles of the participating entity sets with directed arcs:

Many different cardinalities are possible. Documenting the cardinalities is an essential part of database analysis and design.
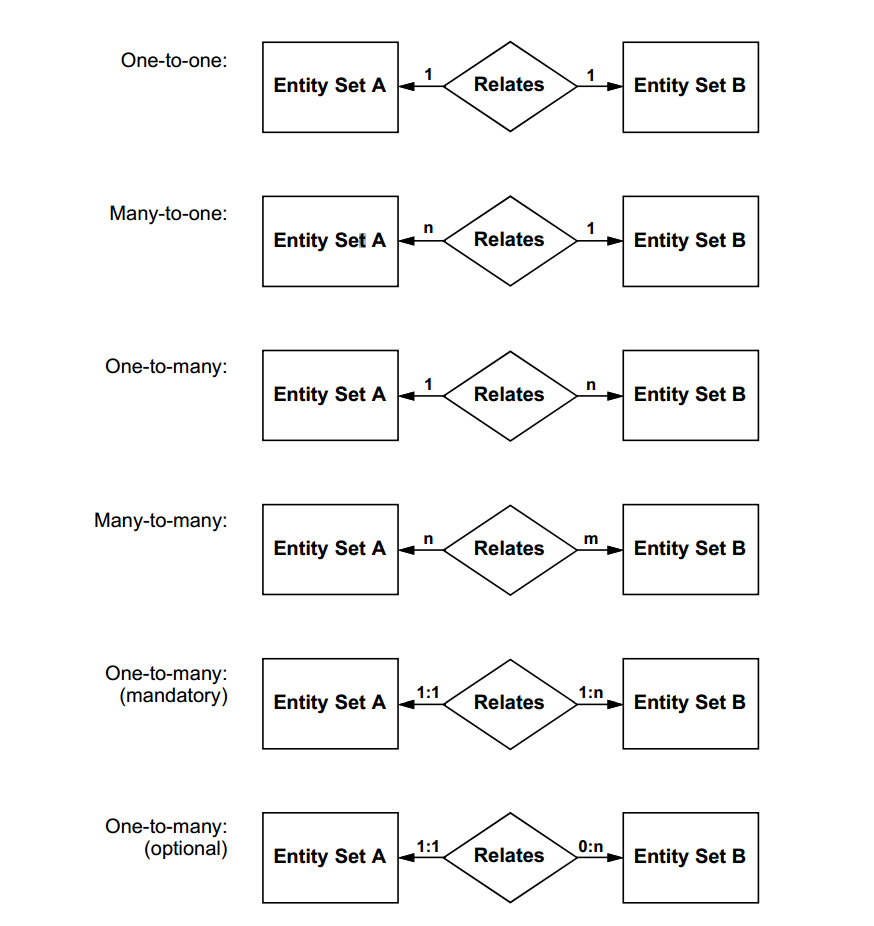
Faculty and departments entities could be related by a many-to-many "member-of" relationship:

They could also be related by a one-to-one "chairman-of" relationship:

Combining these two relationships into a single diagram, we would have:
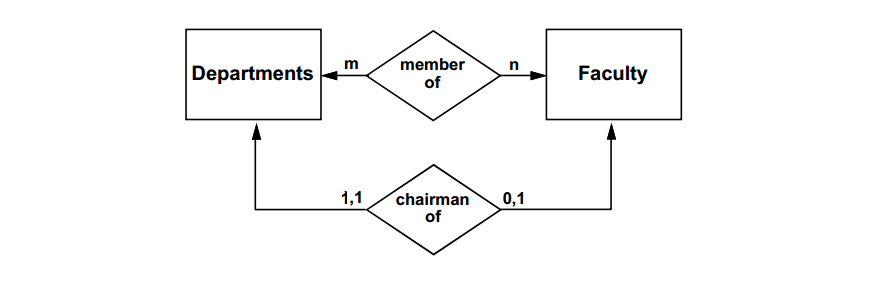
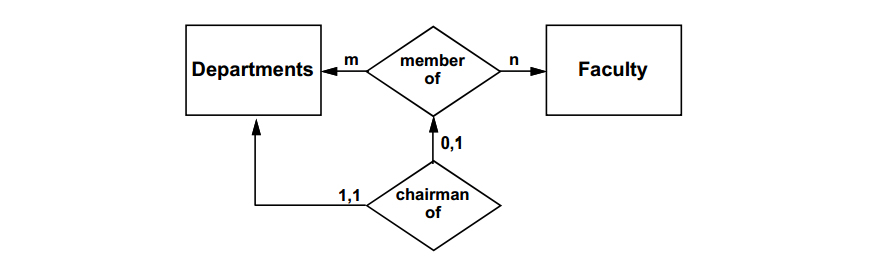
A database design derived from the figure above would allow a faculty member to chair a department of which he/she was not a member. To indicate an integrity constraint that requires membership in a department in order to chair the department, the E-R diagram would be modified as below:
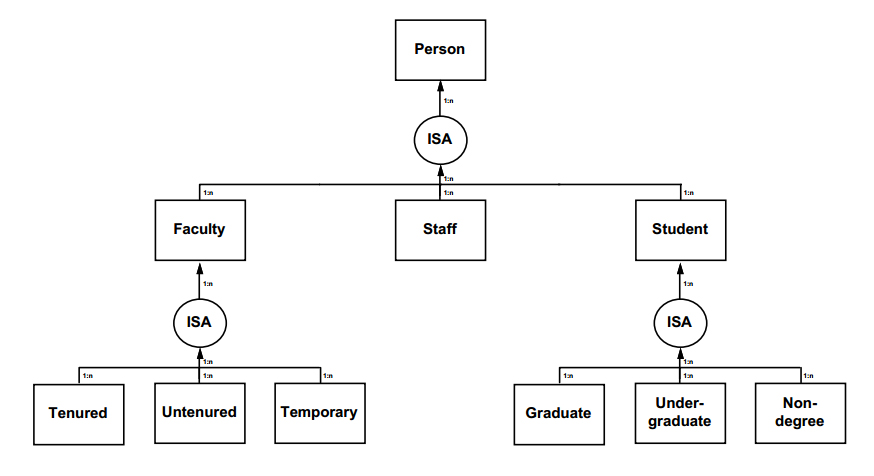
Class hierarchies ("ISA" hierarchies) could be indicated as below:
Relationships may be recursive. Here, this E-R figure represents all possible mother-child relationships among all humans.
RJR Experience and Expertise
Researcher
Robbins holds BS, MS, and PhD degrees in the life sciences. He served as a tenured faculty member in the Zoology and Biological Science departments at Michigan State University. He is currently exploring the intersection between genomics, microbial ecology, and biodiversity — an area that promises to transform our understanding of the biosphere.
Educator
Robbins has extensive experience in college-level education: At MSU he taught introductory biology, genetics, and population genetics. At JHU, he was an instructor for a special course on biological database design. At FHCRC, he team-taught a graduate-level course on the history of genetics. At Bellevue College he taught medical informatics.
Administrator
Robbins has been involved in science administration at both the federal and the institutional levels. At NSF he was a program officer for database activities in the life sciences, at DOE he was a program officer for information infrastructure in the human genome project. At the Fred Hutchinson Cancer Research Center, he served as a vice president for fifteen years.
Technologist
Robbins has been involved with information technology since writing his first Fortran program as a college student. At NSF he was the first program officer for database activities in the life sciences. At JHU he held an appointment in the CS department and served as director of the informatics core for the Genome Data Base. At the FHCRC he was VP for Information Technology.
Publisher
While still at Michigan State, Robbins started his first publishing venture, founding a small company that addressed the short-run publishing needs of instructors in very large undergraduate classes. For more than 20 years, Robbins has been operating The Electronic Scholarly Publishing Project, a web site dedicated to the digital publishing of critical works in science, especially classical genetics.
Speaker
Robbins is well-known for his speaking abilities and is often called upon to provide keynote or plenary addresses at international meetings. For example, in July, 2012, he gave a well-received keynote address at the Global Biodiversity Informatics Congress, sponsored by GBIF and held in Copenhagen. The slides from that talk can be seen HERE.
Facilitator
Robbins is a skilled meeting facilitator. He prefers a participatory approach, with part of the meeting involving dynamic breakout groups, created by the participants in real time: (1) individuals propose breakout groups; (2) everyone signs up for one (or more) groups; (3) the groups with the most interested parties then meet, with reports from each group presented and discussed in a subsequent plenary session.
Designer
Robbins has been engaged with photography and design since the 1960s, when he worked for a professional photography laboratory. He now prefers digital photography and tools for their precision and reproducibility. He designed his first web site more than 20 years ago and he personally designed and implemented this web site. He engages in graphic design as a hobby.
RJR Picks from Around the Web (updated 11 MAY 2018 )
Old Science

Weird Science
Treating Disease with Fecal Transplantation
Fossils of miniature humans (hobbits) discovered in Indonesia
Paleontology
Dinosaur tail, complete with feathers, found preserved in amber.
Astronomy

Mysterious fast radio burst (FRB) detected in the distant universe.
Big Data & Informatics

Big Data: Buzzword or Big Deal?
Hacking the genome: Identifying anonymized human subjects using publicly available data.